%201.svg)
The impact of disability on young people and their family
The New Zealand (NZ) Government’s vision is for NZ to be a non-disabling society “where disabled people have an equal opportunity to achieve their goals and aspirations” (1). Disabled people are more likely to experience disadvantage across a wide range of outcomes including education, housing, economic security and health and wellbeing (2-4). Approximately 11% of young people in NZ have a disability (5) therefore it is important to understand what their experiences are to better inform policies that promote their wellbeing.

This report takes a unique look at disability using a combination of parent and young person viewpoints that provides a deeper understanding at both the individual and family level.

Disabled young person
Describes self-reported and parent-reported concerns for young people with significant difficulties with one or more of the following:
- Seeing
- Hearing
- Walking / climbing stairs
- Remembering
- Concentrating
- Self-care
- Communicating
- Learning new things
- Accepting changes to their routine
- Controlling their behaviour
- Diagnosis of depression and/or anxiety
The definition of disability for analysis related to educational outcomes includes young people with an additional learning need (e.g., a specific learning disability, speech and language difficulty, or learning disability).
See Supplementary Material for more information.
Family disability
Describes the impact of having a disabled child and/or parent on the family unit. This included:
- Disabled young people.
- Parents (mother/main caregiver and/or partner) who self-reported a long-term (six months or more) disability.
Family disability was derived as a three-category variable:
- No disability within the family.
- Families where only the young person had a disability.
- Families where one or both parents had a long-term disability - the young person may also have had a disability.
Note: Family disability did not include siblings or others living in the household who may have had a disability. See Supplementary Material for more information.
To ensure we reflect the voices of the young people and their whānau, this report takes an inclusive and holistic measurement approach, utilising both young person self-report and parent/main caregiver reported concerns.
Although we did not ask explicitly whether young people identified themselves as “disabled”, using a functional impairment approach to define disability in this report means we can look at outcomes for young people at risk of disablement.
Additionally, our family-centred approach to disability has allowed us to highlight the impact of disability on the family and assess potential effects on the young person’s life. For additional information on the derivation of the disability measures, please see Supplementary Material.
Insight one
Self-reported disability differed by gender, ethnic group, and area level deprivation.
At 12 years of age 9.8% of young people self-reported one or more functional impairments placing them at an increased likelihood of disablement. The proportions were higher for transgender, non-binary and those unsure of their gender, rangatahi Māori, and Pacific young people, and those living in areas of high deprivation.
The proportion of disabled transgender/non-binary/unsure young people (18.8%) was twice that of either cisgender girls (8.4%) or cisgender boys (7.8%).
13.0% of Māori and 14.5% of Pacific young people had a disability compared to 8.1% in the sole European ethnic group.
A greater proportion of disabled young people lived in areas of high deprivation (quintile 5 - 15.4% versus quintile 1 - 7.6%).
Insight two
Disabled young people reported poorer health and wellbeing outcomes.
When considering both self-report and parent-report of functional impairment, 19.4% of young people were identified as disabled. Although, nearly half of disabled young people reported their health was very good or excellent, a greater proportion rated their health as either fair or poor compared to young people without a disability. Disabled young people reported poorer health related quality of life, had worse/higher depression and anxiety scores (see Young people's experiences of depression and anxiety symptoms report for more detail on these measures), and were less likely to have seen a health provider/GP when needed.

General health
Nearly half (47.0%) of disabled young people rated their health as “very good” or “excellent” followed by “good” (39.4%).
13.5% of disabled young people rated their general health as “fair” or “poor” compared to just 5.6% for those with no disability.

Health related quality of life
Over half (53.6%) of disabled young people reported their quality of life as low and 32.3% reported an average quality of life.
Only 14.2% of disabled young people reported high quality of life compared to 32.7% of young people with no disability.

Mental health
Depression symptoms were higher for disabled young people.
Anxiety symptoms were higher for disabled young people.

Access to health services
9.3% of disabled young people did not see a GP when they needed to compared to 5.5% of young people with no disability.
.png)
The KIDSCREEN tool is suitable for all children and teenagers aged from eight to 18 years. It provides a generic measure of quality of life that is related to children’s health. For more information on this tool see Supplementary Material.
Insight three
Disabled young people reported poorer relationships with their peers and parents and were less satisfied with their parents’ involvement in their lives.
To explore the meaningful relationships in the lives of the cohort we asked a series of questions about their relationships with both their peers and parents. For parent-child and peer relationship scales, higher scores indicated less trusting and communicative relationships. We also asked the young people about the level of involvement their parents and caregivers had in their lives, and whether they would like to increase, keep the same, or decrease their parent’s level of involvement. Disabled young people reported less trusting and communicative relationships (had higher scores) with both their peers and parents and were less content with their parent’s level of involvement at both ends of the spectrum.
Quality of relationships.
Peer relationship score for disabled young people was higher (mean 18.02±SD 6.54) than for young people with no disability (mean 16.53±STD 5.98).
Parent-child relationship score for disabled young people was higher (mean 14.0±SD 5.20) than for young people with no disability (mean 11.97±SD 4.22).
Parental Involvement.
Larger proportions of disabled young people were dissatisfied with the level of involvement their parents had in their lives.
7.9% of disabled young people wanted a little or a lot less parental involvement in their lives compared to 6.2% of young people with no disability.
30.7% of disabled young people wanted a little or a lot more parental involvement in their lives compared to 24.2% of young people with no disability.
Insight four
Disabled young people felt less safe in their neighbourhoods, had lower school engagement, and experienced disparities in access to extra-curricular activities and learning support services.
Disabled young people felt less safe in their neighbourhoods both during the day and at night. They had lower school engagement scores than young people with no disability and reported higher rates of being unable to do an extra-curricular activity they wanted to do. Families accessing a disability or learning support service for their disabled child were not always receiving all the support they needed.

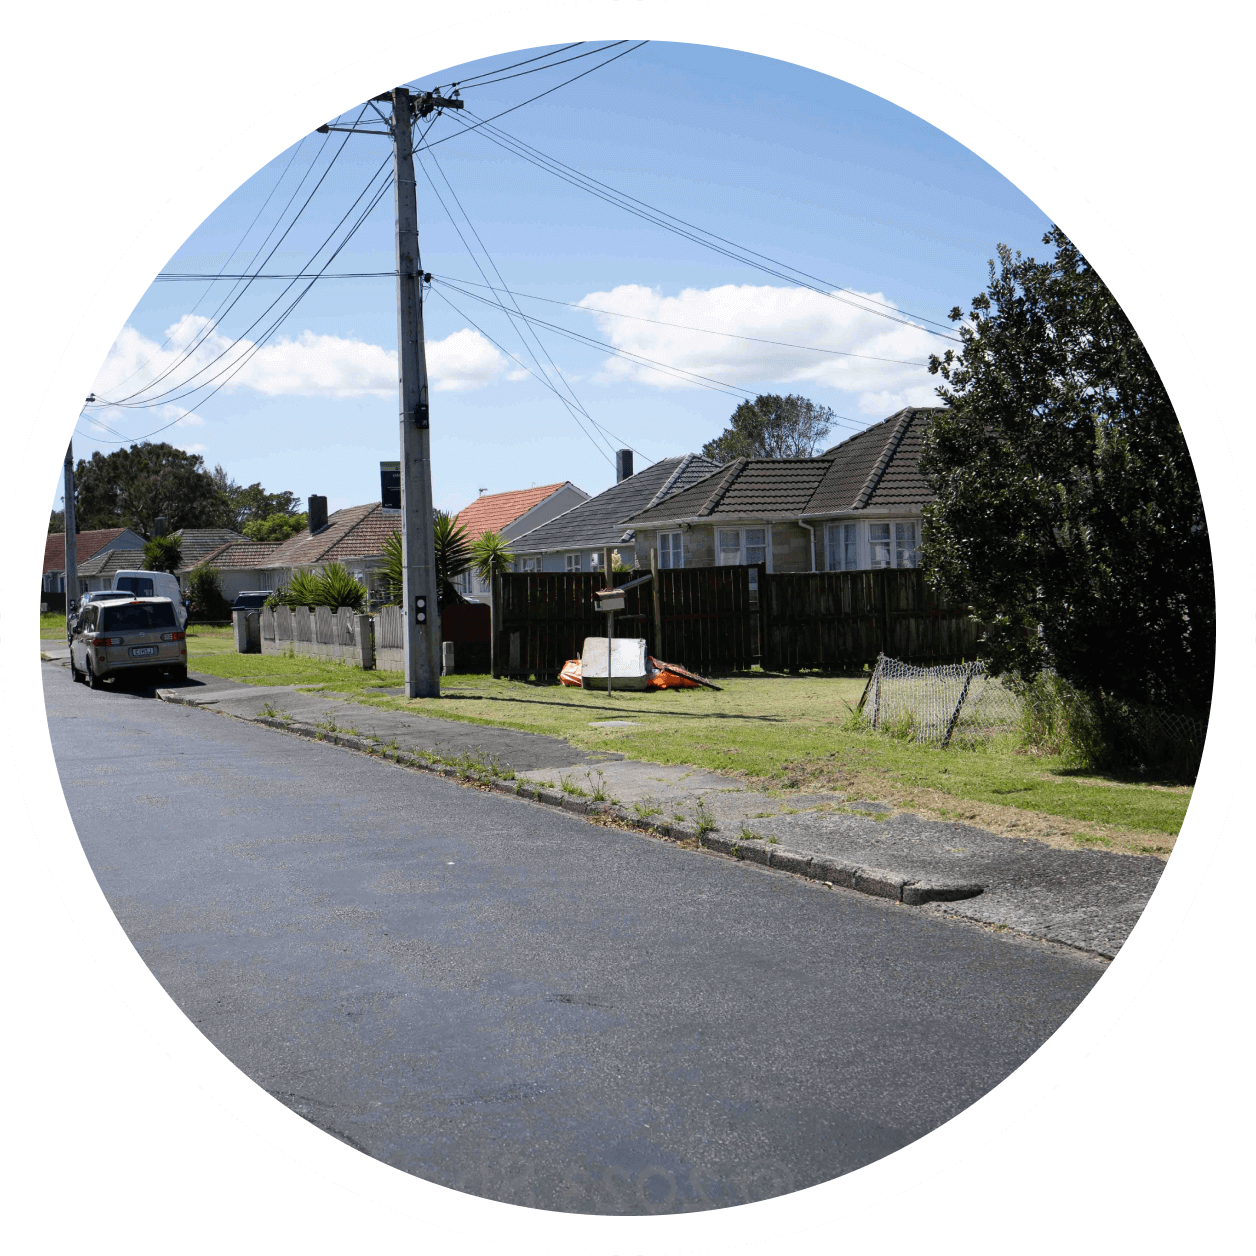
Safety in the neighbourhood
68.5% of disabled young people agreed it was safe in their neighbourhood during the day compared to 78% of young people with no disability.
44.0% agreed it felt safe in their neighbourhood at night compared to 51.7% of young people with no disability.

School engagement and extra-curricular activities
Disabled young people had lower mean school engagement scores (3.53±SD 0.71) compared to young people with no disability (3.84±SD 0.66).
A third (34.3%) of disabled young people wanted to do an extra-curricular activity but were unable to compared to 28.3% of young people with no disability.

Learning support services
6.3% (n = 266) of families had accessed disability and learning support services at school.
Nearly 40% of disabled young people did not receive some or all the support they needed.
Insight five
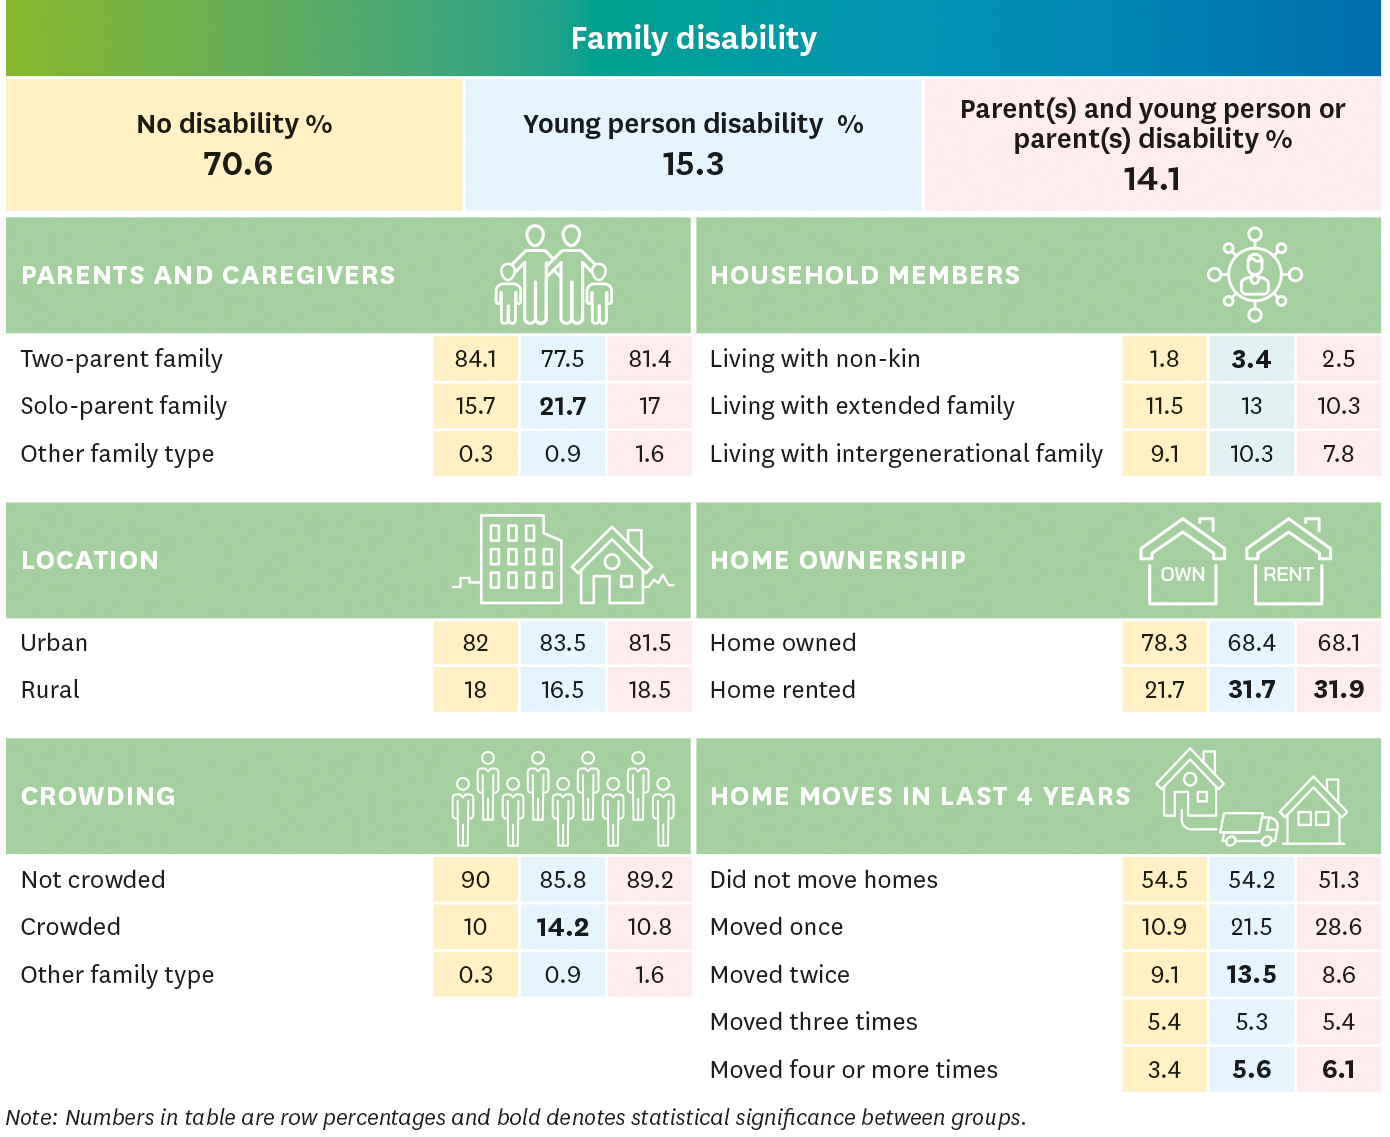
A greater proportion of families with disability were living in sole-parent homes, had poorer housing quality, were more likely to have lived in rental homes or experienced crowding, and had greater residential instability.
Almost one third of families in our study were experiencing disability. This included over 600 mothers/main caregivers or partners. A greater proportion of families with a disabled young person were sole-parent homes, and a greater proportion lived in homes with non-kin. A greater proportion of families with disability (either young person or parent(s) and young person) lived in rental homes, had experienced crowded housing, and had moved house more often in the last four years.
Insight Six
Families experiencing disability had inequitable annual incomes and had greater material hardship.
Families experiencing disability had lower equivalised annual incomes, were more likely to be living in the most deprived areas in NZ and had experienced more persistent experiences of deprivation across the young person’s life. They were also more likely to have experienced material hardship at 12 years, and both increasing and persistent hardship across time compared to families with no disability.
Economic wellbeing
Equivalised annual family income
For families with:
No disability was $62,658.
A disabled young person was $55,611.
Disabled parent(s) and young person or parent(s) was $53,629.
Area level deprivation
High area level deprivation at 12 years – disabled young person 23.7%, disabled parent(s) and young person or parent(s) 19.8%, no disability 15.7%.
13.1.% of families with a disabled young person lived in high deprivation areas at every DCW in the study (6/6 timepoints).
Material hardship
At the 12-year DCW, 23.7% of families with a disabled young person were living in an area of high deprivation, compared to 19.8% of disabled parent(s) and young people or parent(s), and 15.7% of families with no disability.
12.9% of families with disabled parent(s) and young people or parent(s) had experienced increasing and/or persistent material hardship longitudinally.
Relevance for policy
and practice.
This report has examined outcomes for disabled young people in NZ at aged 12 years. In line with previous research findings (2-4), we found that disabled young people tended to have poorer outcomes in health, wellbeing, education, relationships, and sense of safety.

Self-reported disability differed by gender, ethnic group, and area level deprivation.
Rangatahi Māori and Pacific young people were disproportionately represented in the number of disabled young people. GUiNZ provides an opportunity for Government, and those working to support tangata whaikaha, by providing new and detailed information about experiences of disability at the individual and whānau level and gives an opportunity to understand how identifying as Māori and disabled impacts on young people’s lives.
Like previous research (6,7), we found that a significant proportion of disabled young people were also transgender, non-binary or unsure of their gender. It is vital that health services for disabled young people and their whānau are welcoming of all young people and include training and upskilling to recognise and respond to the needs of rainbow young people and their whānau.
Disabled young people reported poorer health and wellbeing outcomes.
The NZ Disability Strategy (1) highlights a need for disabled people to have equitable access to healthcare services, and healthcare services that are inclusive and responsive. This report found that general health and mental health outcomes are currently not equitable for disabled young people (at aged 12) compared to those with no disability. In alignment with strategic documents designed to focus on changing the inequities within the health and wellbeing domain, specifically relating to health outcomes and access to health services, we recommend urgent action. For example, Te Pae Tata (the Interim NZ Health Plan 2022) (8) sets out disabled people’s health and wellbeing as a priority focus and highlights the importance of the development of the Health of Disabled People Strategy (9).
Disabled young people reported poorer relationships with their peers and parents and were less satisfied with their parents’ involvement in their lives.
Ensuring safe and inclusive school environments for disabled young people may facilitate more trusting and communicative relationships with their peers. One way of building more inclusive school environments for disabled young people is through initiatives to prevent and respond to bullying in schools – outlined as an action in the Child and Youth Wellbeing Strategy (10). The Statement of National Education and Learning Priorities (11) also includes reducing barriers to education for disabled learners/ākonga as an objective.
Disabled young people also reported less trusting and communicative relationships with their parents and less satisfaction with the degree to which their parents are involved in their lives. Policies that provide additional support for parents could include, greater financial assistance, the alleviation of some caregiving responsibilities, and guidance for parenting disabled young people. Further investigation into the determinants of disabled young people’s poorer relationships with parents could help to identify the specific areas where the parents and whānau require greater support.
Disabled young people felt less safe in their neighbourhood, had lower school engagement, and experienced disparities in access to extra-curricular activities and learning support services.
More support is needed to ensure young people with disabilities feel safe in their communities. This includes creating spaces that are inclusive and accessible. Young people with disabilities identify such spaces as critical to their wellbeing (12).
Increasing the support for disabled young people within schools and in extra-curricular activities would not only have benefits for education outcomes but may also have an indirect effect on the health, wellbeing, and economic status of their whānau. That is, as families are better supported, they have a greater capacity to create supportive homes and environments. Screening for additional learning support needs and supports that are responsive to needs, will be key to successfully achieving the outcomes set out in the NZ Disability Strategy (1).
A greater proportion of families with disability were single parent homes, lived with poorer housing quality, experienced greater residential instability, and had more persistent experiences of deprivation and hardship.
More needs to be done to address the inequities experienced by young people and their families to ensure that they experience financial stability and are supported in ways that meet individual needs. Government initiatives currently underway are intended to reduce these disparities (10), such as ‘Ka Ora, Ka Ako’, the Equity Index in schools, and implementation of Healthy Homes Standards. Furthermore, children and families with disabilities must be given access to the resources they need to lead healthy and fulfilling lives.
There is a need to take a holistic view of these issues as improvements in relation to the health, economic and social wellbeing of whānau can have a positive impact on young people’s outcomes across their life.
References and
research methods
At Growing Up in New Zealand, we're passionate about advancing research and making sure our work is informed by a wide range of sources. That's why we've included a comprehensive list of references, along with an introduction and a detailed report of the research methods used to support the Growing Up in New Zealand study.
Read the full report
We’ve carried out more than 90,000 interviews and collected more than 50 million pieces of data to help inform policy and help give children the best start in life.