%201.svg)
Access to services
Extreme weather events can destroy infrastructure needed for services such as power, water, and telecommunications. Across the North Island, Cyclone Gabrielle caused wide spread damage to power line networks, with 332,000 households cut off during the cyclone [8]. This extensive loss of power also meant that cell phone connectivity was down, with 660 mobile towers disconnected [8].
Water and wastewater infrastructure was also damaged, notably in Gisborne, where repairs to the water supply pipe into the city lasted for 45 days [36]. Furthermore, because of damage from Cyclone Gabrielle, roads, motorways, and bridges were closed across the North Island [10, 37]. Buses, trains, and ferries were delayed, detoured, or cancelled (including school bus services) [10, 37]. Hawke’s Bay and Gisborne experienced significant damage to infrastructure, causing communities to be cut off [10]. Restoration and repairs are long-term and still ongoing [11, 38]. Growing Up in New Zealand asked about access to services (gas, internet, phone coverage, power, water, and public transport) for the young person and their primary caregiver.
Figure 16 . Shows mother/primary caregiver reported disruption to services due to the extreme weather events.
We asked the mothers/primary caregivers if they experienced disruption to any services (gas, internet, landline phone, mobile phone coverage, power, water, or none of the above) during or after the floods. This graph shows the number of mothers/primary caregivers who reported ‘yes’ the service was disrupted (bottom bar) or ‘no’ the service was not disrupted (top bar).Each bar is categorised by those who were affected (dark blue; n = 216, 26.7%), live in an area affected (light blue; n = 239, 29.6%), or were not affected (green; n = 353, 43.7%) by the extreme weather events.
Table 1.Number and Proportion of mothers/primary caregivers who reported disruption to services, reported for the total sample and for those affected, live in an area affected, and not affected.
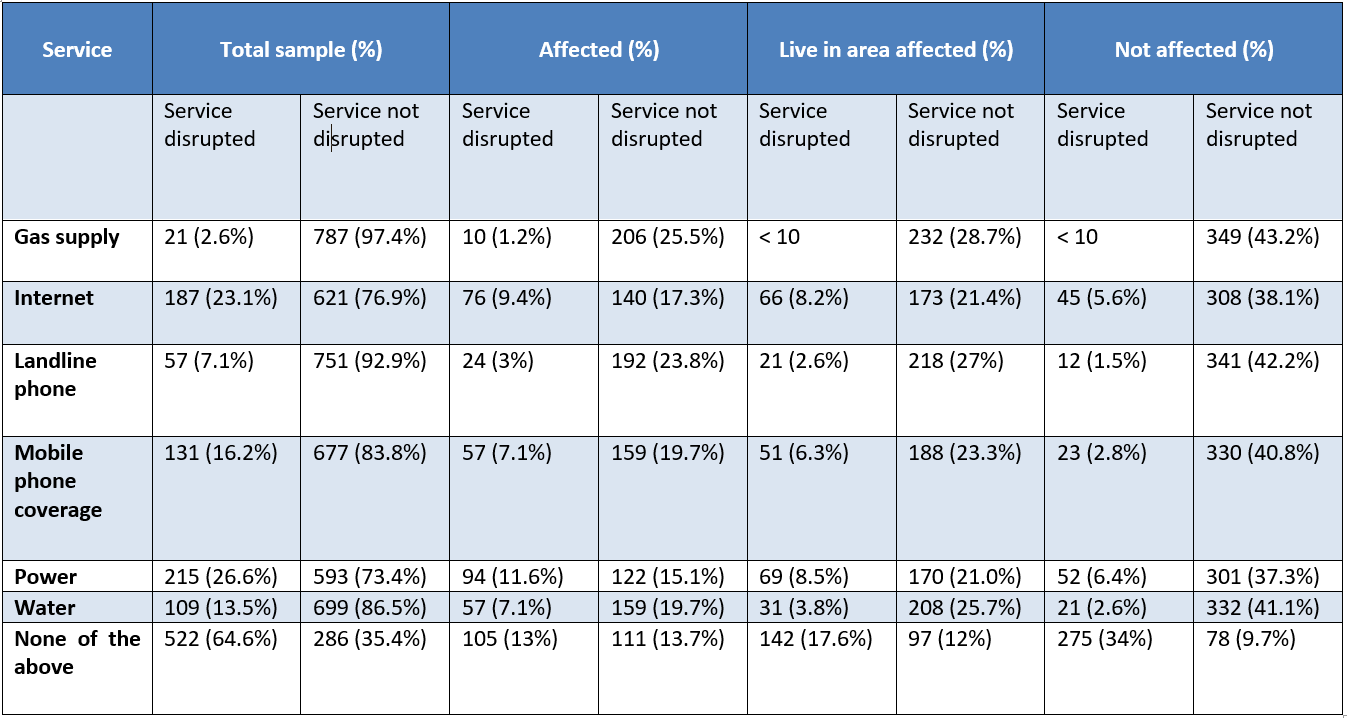
Figure 17 . Shows how long the services were disrupted for as reported by the mother/primary caregiver.
We asked those mothers/primary caregivers who reported disruption to services ( gas supply: n = 21, internet: n = 187, landline phone: n = 57, mobile phone coverage: n = 131, power: n = 215, water: n = 109) how long the service was disrupted for. In this graph, each bar represents the different type of service (gas supply, internet, landline phone, mobile phone coverage, power, and water) and shows the number of participants who reported disruption for less than 2 days, 3 or more days, still disrupted, or not applicable.
Young person reported transport
Public transport
Among the young people who participated in the Extreme Weather Survey (n = 680), over half (60.6%, n = 412) reported that the floods and/or cyclone did not impact their ability to use public transport, more than 1 in 5 (22.4%, n = 152) reported that their ability to use public transport was impacted, 16.3% (n = 111) answered ‘not applicable’, and less than 10 were missing.
Car
Of the young people who completed the Extreme Weather Survey (n = 680), over two thirds (67.1%, n = 456) reported that the floods and/or cyclone did not impact their ability to go to and from places by car, more than 1 in 4 (26.8%, n = 182) reported that this was impacted, 5.4% (n = 37) answered ‘not applicable’, and less than 10 were missing.

Young person from South Auckland

Young person from Te Tai Tokerau/Northland
Young person from South Auckland
References
Suggested citation: Gawn, J., Fletcher, B.D., Neumann, D., Pillai, A., Miller, S., Park, A., Napier, C., Paine, S.J. (2024). The impact of extreme weather events on young people and their families: Evidence from Growing Up in New Zealand. Auckland: Growing Up in New Zealand. Available from: www.growingup.co.nz
National Emergency Management Agency. Storms and severe weather. Retrieved from https://www.civildefence.govt.nz/cdem-sector/consistent-messages/storms-and-severe-weather
Ministry for the Environment, National Climate Change Risk Assessment for New Zealand: Snapshot. 2020.
Jay, A., et al., Overview, in Impacts, Risks, and Adaptation in the United States: Fourth National Climate Assessment, Volume II, D.R. Reidmiller, et al., Editors. 2018: U.S. Global Change Research Program, Washington, DC, USA. p. 33-71.
NIWA. Auckland suffers wettest month in history. 2023; Available from: https://niwa.co.nz/news/auckland-suffers-wettest-month-in-history.
New Zealand Infrastructure Commission, The 2023 Auckland Anniversary weekend storm: An initial assessment and implications for the infrastructure system 2023.
Newsroom. Auckland’s historic flooding explained in five charts. 2023; Available from: https://www.newsroom.co.nz/sustainable-future/aucklands-historic-flooding-explained-in-five-charts#:~:text=The%20longest%20running%20weather%20record,that%20lasted%20nearly%20four%20decades.
Ministry of Foreign Affairs and Trade, Cyclone Gabrielle’s impact on the New Zealand economy and exports: A market intelligence report. 2023.
Wilson, N., A. Broadbent, and J. Kerr, Cyclone Gabrielle by the numbers – A review at six months. 2023: Public Health Communciation Centre and Department of Public Health, University of Otago, Wellington.
National Emergency Management Agency. Declared States of Emergency. 2023; Available from: https://www.civildefence.govt.nz/resources/previous-emergencies/declared-states-of-emergency.
Hawkes Bay Regional Council. Cyclone Gabrielle impacts. 2023; Available from: https://www.hbrc.govt.nz/our-council/cyclone-gabrielle-response/cyclone-gabrielle-impacts/.
NZTA. Hawke's Bay cyclone recovery. 2023; Available from: https://www.nzta.govt.nz/projects/hawkes-bay-cyclone-recovery/.
Simpson, D.M., I. Weissbecker, and S.E. Sephton, Extreme weather-related events: Implications for mental health and well-being, in Climate change and human well-being: Global challenges and opportunities. 2011, Springer Science + Business Media: New York, NY, US. p. 57-78.
Curtis, S., et al., Impact of extreme weather events and climate change for health and social care systems. Environmental Health, 2017. 16(S1).
Te Uru Kahika, Before the deluge: Building flood resilience in Aotearoa. 2022.
Barkin, J.L., et al., Effects of extreme weather events on child mood and behavior. Developmental Medicine & Child Neurology, 2021. 63(7): p. 785-790.
Beaglehole, B., et al., A systematic review of the psychological impacts of the Canterbury earthquakes on mental health. Australian and New Zealand Journal of Public Health, 2019. 43(3): p. 274-280.
Fergusson, D.M., et al., Impact of a Major Disaster on the Mental Health of a Well-Studied Cohort. JAMA Psychiatry, 2014. 71(9): p. 1025.
Rocque, R.J., et al., Health effects of climate change: an overview of systematic reviews. BMJ Open, 2021. 11(6): p. e046333.
Beaglehole, B., et al., The long-term impacts of the Canterbury earthquakes on the mental health of the Christchurch Health and Development Study cohort. Australian and New Zealand journal of psychiatry, 2023. 57(7): p. 966-974.
Ebi, K.L., et al., Extreme Weather and Climate Change: Population Health and Health System Implications. Annual Review of Public Health, 2021. 42(1): p. 293-315.
Dahl, R.E., et al., Importance of investing in adolescence from a developmental science perspective. Nature, 2018. 554(7693): p. 441-450.
Eiland, L. and R.D. Romeo, Stress and the developing adolescent brain. Neuroscience, 2013. 249: p. 162-171.
Ma, T., J. Moore, and A. Cleary, Climate change impacts on the mental health and wellbeing of young people: A scoping review of risk and protective factors. Soc Sci Med, 2022. 301: p. 114888.
Perry, B., The material wellbeing of New Zealand households: trends and relativities using non-income measures, with international comparisons. 2015: Wellington, New Zealand: Ministry of Social Development.
Perry, B., The material wellbeing of NZ households: Overview and Key Findings from the 2017 Household Incomes Report and the companion report using non-income measures (the 2017 NIMs Report). . 2017: Wellington, New Zealand: Ministry of Social Development. .
Turrell, G., A. Kavanagh, and S.V. Subramanian, Area variation in mortality in Tasmania (Australia): the contributions of socioeconomic disadvantage, social capital and geographic remoteness. Health Place, 2006. 12(3): p. 291-305.
Ministry of Education. Severe weather event education update. 2023; Available from: https://www.education.govt.nz/news/severe-weather-event-education-update/
Ministry of Education. Severe weather event and school closure. 2023; Available from: https://www.education.govt.nz/news/severe-weather-event-information/
Ministry of Education, Schools On-site Attendance 13 February 2023 –17 February 2023. 2023.
Ministry of Education. Severe weather event: Cyclone Gabrielle update. 2023; Available from: https://www.education.govt.nz/news/severe-weather-event-tropical-cyclone-gabrielle-update/.
New Zealand Government, Summary of Initiatives in the North Island Weather Events Response and Recovery Package. 2023.
Tinetti, J. Govt to repair or rebuild all weather-hit schools. 2023; Available from: https://www.beehive.govt.nz/release/govt-repair-or-rebuild-all-weather-hit-schools.
Gheytanchi, A., et al., The dirty dozen: twelve failures of the hurricane katrina response and how psychology can help. Am Psychol, 2007. 62(2): p. 118-30.
IPCC, Managing the Risks of Extreme Events and Disasters to Advance Climate Change Adaptation, in A Special Report of Working Groups I and II of the Intergovernmental Panel on Climate Change, C.B. Field, et al., Editors. 2012: Cambridge University Press, Cambridge, UK, and New York, NY, USA,.
Insurance Council of New Zealand. 2023 Climate Disaster Payouts Top $2 Billion. 2023; Available from: https://www.icnz.org.nz/industry/media-releases/2023-climate-disaster-payouts-top-2-billion/.
Wilson, N., et al., Water infrastructure failures from Cyclone Gabrielle show low resilience to climate change. 2023: Public Health Communciation Centre and Department of Public Health, University of Otago, Wellington.
The Spinoff. Cyclone Gabrielle: The latest official Auckland travel updates from AT and NZTA. 2023; Available from: https://thespinoff.co.nz/society/13-02-2023/cyclone-gabrielle-the-latest-official-auckland-travel-updates-from-at-and-nzta.
Auckland Transport. Updates on Repairs. 2023; Available from: https://at.govt.nz/projects-roadworks/road-works-disruptions/long-term-road-repairs-from-auckland-storms/updates-on-repairs.
Ravens-Sieberer, U., et al., Reliability, construct and criterion validity of the KIDSCREEN-10 score: a short measure for children and adolescents’ well-being and health-related quality of life. Quality of Life Research, 2010. 19(10): p. 1487-1500.
Connor, K.M. and J.R.T. Davidson, Development of a new resilience scale: The Connor-Davidson Resilience Scale (CD-RISC). Depression and Anxiety, 2003. 18(2): p. 76-82.
Radloff, L.S., The CES-D Scale: A Self-Report Depression Scale for Research in the General Population. Applied psychological measurement, 1977. 1(3): p. 385-401.
Irwin, D.E., et al., An item response analysis of the pediatric PROMIS anxiety and depressive symptoms scales. Quality of Life Research, 2010. 19(4): p. 595-607.
Kroenke, K., R.L. Spitzer, and J.B.W. Williams, The PHQ-9. Journal of General Internal Medicine, 2001. 16(9): p. 606-613.
Spitzer, R.L., et al., A Brief Measure for Assessing Generalized Anxiety Disorder. Archives of Internal Medicine, 2006. 166(10): p. 1092.
Ministry of Health, Measuring Health States: The World Health Organization – Long Form (New Zealand Version) Health Survey: Acceptability, reliability, validity and norms for New Zealand. Public Health Intelligence Occasional Bulletin No. 42. 2007: Wellington: Ministry of Health.
Meet our team

Learn more about the people who make Growing Up in New Zealand happen.
Our newsletter

Keep up-to-date with our latest news, events and research.
Current projects

Find out more about the research projects currently underway using Growing Up in New Zealand information.