%201.svg)
Mental health
The destruction and stress caused by an extreme weather event can take a toll on the mental health of individuals, families and communities. Young people and their families may experience elevated mental ill-being symptoms during, following, and even months after the floods or cyclone. Growing Up in New Zealand asked young people and their primary caregiver about their general quality of life, resilience, depression symptoms and anxiety symptoms. We describe these mental health and wellbeing aspects experienced at 6 months after the extreme weather events.
Please note that additional research is required to determine if those who experience poorer mental health symptoms were more likely to report feeling affected by the extreme weather events or if experiencing extreme weather events resulted in poorer mental health outcomes.
Young person reported mental health and wellbeing
Figure 25 . Shows young people’s self-reported quality of life scores by how affected they felt by the extreme weather events.
Quality of life – young person
The KIDSCREEN-10 measures quality of life which is a subjective evaluation of general health and well-being [39]. The KIDSCREEN-10 quality of life mean scores range from 1 to 5, with higher scores indicating greater quality of life. This graph shows the proportion of quality of life mean scores ranging from 1 to 5 for three groups of young people: those who were affected (dark blue; n = 166, 24.8%, M = 3.69, 95% CI = 3.59-3.79), knew someone else affected (light blue; n = 184, 27.5%, M = 3.63, 95% CI = 3.54-3.73), or were not affected (green; n = 320, 47.8%, M = 3.78, 95% CI = 3.72-3.85) by the extreme weather events. Overall, there was no difference in quality of life scores between those who were affected, knew someone else affected, or were not affected by the extreme weather events.
Figure 26 . Shows young people’s self-reported resilience scores by how affected they felt by the extreme weather events.
Resilience - young person
The Connor Davidson Resilience Scale 2-item (CD-RISC 2) measures the ability to adapt and bounce back after adversity [40]. The CD-RISC 2 scores range from 0 to 8, with higher scores indicating greater resilience.This graph shows the proportion of resilience scores ranging from 0-8 for three groups of young people: those who were affected (dark blue; n = 166, 24.8%, M = 5.40, 95% CI 5.16-5.65), knew someone else affected (light blue; n = 184, 27.5%, M = 5.58, 95% CI 5.36-5.81), or were not affected (green; n = 320, 47.8%, M = 5.08, 95% CI 4.89-5.28) by the extreme weather events.Overall, there was no difference between resilience scores for those who were affected, knew someone else affected, or were not affected by the extreme weather events.
Figure 27 . Shows young people’s self-reported depression symptoms by how affected they felt by the extreme weather events.
Depression symptoms – young person
The Centre for Epidemiological Studies Depression 10-item (CES-D-10) measures symptoms of depression including depressed mood, tiredness, feelings of guilt, feelings of helplessness and hopelessness, trouble concentrating, and difficulty sleeping, during the past week [41]. The CES-D-10 depression symptom scores range from 0 to 30, with higher scores indicating greater depression symptoms.This graph shows the proportion of depression symptom scores ranging from 0-30 for three groups of young people: those who were affected (dark blue; n = 165, 24.7%, M = 8.79, 95% CI7.84-9.75), knew someone else affected (light blue; n = 184, 27.5%, M = 8.59, 95% CI 7.72 –9.47), or were not affected (green; n = 319, 47.8%, M = 6.70, 95% CI 6.21-7.20) by the extreme weather events.On average, young people who were affected or knew someone else affected by the extreme weather events reported higher depression scores compared to young people who were not affected by the extreme weather events.
Figure 28 . Shows young people’s self-reported anxiety symptoms by how affected they felt by the extreme weather events.
Anxiety symptoms – young person
The PROMIS Anxiety Scale measures symptoms of anxiety including fear, anxious misery, and an overactive mind, during the past week [42]. The PROMIS anxiety symptom scores range from 33.5 to 83.3, with higher scores indicating greater anxiety symptoms.This graph shows the proportion of anxiety symptom scores ranging from 33.5-83.3 for three groups of young people: those who were affected (dark blue; n = 165, 24.4%, M = 46.96, 95% CI 45.19-48.73), knew someone else affected (light blue; n = 184, 27.9%, M = 46.28, 95% CI 44.65-47.90), or were not affected (green; n = 317, 47.6%, M = 42.98, 95% CI 41.92-44.05) by the extreme weather events.On average, young people who were affected or knew someone else affected by the extreme weather events reported higher anxiety scores, compared to the young people who were not affected by the extreme weather events.
Mother/primary caregiver reported mental health and wellbeing
Figure 29 . Shows mother/primary caregiver reported resilience scores by how affected they felt by the extreme weather events.
Resilience – mother/primary caregiver
The Connor Davidson Resilience Scale 2-item (CD-RISC 2) measures the ability to adapt and bounce back after adversity [40]. The CD-RISC 2 scores range from 0 to 8, with higher scores meaning higher resilience.This graph shows the proportion of resilience scores ranging from 0-8 for three groups of mothers/primary caregivers: those who were affected (dark blue; n = 207, 26.5%, M = 5.84, 95% CI 5.61-6.07), live in an area that was affected (light blue; n = 231, 29.5%, M = 5.74, 95% CI 5.51-5.96), or were not affected (green; n = 344, 44.0%, M = 5.67, 95% CI 5.48-5.86) by the extreme weather events.Overall, there does not appear to be a difference between resilience scores for those who were affected, knew someone else affected, or were not affected by the extreme weather events.
Figure 30 . Shows mother/primary caregiver reported depression symptoms by how affected they felt by the extreme weather events.
Depression symptoms – mother/primary caregiver
The 9-item Patient Health Questionnaire (PHQ-9) measures symptoms of depression including depressed mood, tiredness, feelings of guilt, feelings of hopelessness, trouble concentrating, and difficulty sleeping [43]. The PHQ-9 depression symptom scores range from 0 to 27, with higher scores indicating greater depression symptoms. A score of 10 or greater indicates clinically relevant depression symptoms.This graph shows the proportion of mother/primary caregiver depression symptom scores ranging from 0-27 for three groups of mothers/primary caregivers: those who were affected (dark blue; n = 206, 26.4%, M = 6.49, 95% CI = 5.69-7.29), live in an area that was affected (lightblue; n = 229, 29.4%, M = 5.84, 95% CI 5.17-6.51), or were not affected (green; n = 344, 44.2%, M = 5.33, 95% CI 4.78-5.88) by the extreme weather events.Overall, there does not appear to be a difference between depression symptom scores for mothers/primary caregivers who were affected, knew someone else affected, or were not affected by the extreme weather events.
Table 6. Frequency and proportion of clinically relevant depression symptoms scores in the Extreme Weather Survey mother/primary caregiver questionnaire
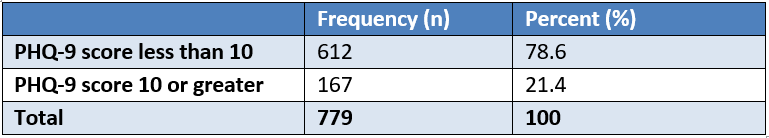
As shown in Table 6, around 1 in 5 (21.4%, n = 167) of mothers/primary caregivers had clinically relevant depression symptoms six months following the extreme weather events.
Figure 31 . Shows mother/primary caregiver reported anxiety symptoms by how affected they felt by the extreme weather events.
Anxiety symptoms – mother/primary caregiver
The 7-item Generalized Anxiety Disorder Screener (GAD-7) measures symptoms of anxiety including feeling nervous, being unable to stop or control worrying, trouble relaxing, and restlessness [44]. The GAD-7 anxiety symptom scores range from 0 to 24, with higher scores indicating greater anxiety symptoms. A score of 10 or greater indicates clinically relevant anxiety symptoms.This graph shows the proportion of anxiety symptom scores ranging from 0-24 for three groups of mothers/primary caregivers: those who were affected (dark blue; n = 206, 26.5%, M = 5.55, 95% CI 4.85-6.24), live in an area that was affected (light blue; n = 228, 29.3%, M = 4.73, 95% CI 4.12-5.34), or were not affected (green; n = 344, 44.2%, M = 4.10, 95% CI 3.62-4.58) by the extreme weather events.On average, mothers/primary caregivers who were affected by the extreme weather events reported greater anxiety symptoms compared to mothers/primary caregivers who were not affected by the extreme weather events. Overall, there does not appear to be a difference between anxiety symptoms for those who knew someone else affected compared to those who were affected or were not affected by the extreme weather events."
Table 7. Frequency and proportion of clinically relevant anxiety symptoms scores in the Extreme Weather Survey mother/primary caregiver questionnaire.
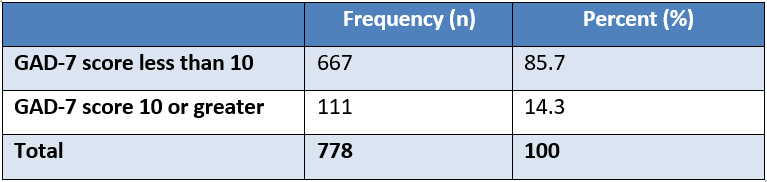
As shown in Table 7, 14.3% (n = 111) of mothers/primary caregivers had clinically relevant anxiety symptoms six months following the extreme weather events. However, it is important to note that this is not a diagnosis of anxiety.

Young person from South Auckland

Young person from South Auckland
Young person from Te Matau-a-Māui/Hawke’s Bay
References
Suggested citation: Gawn, J., Fletcher, B.D., Neumann, D., Pillai, A., Miller, S., Park, A., Napier, C., Paine, S.J. (2024). The impact of extreme weather events on young people and their families: Evidence from Growing Up in New Zealand. Auckland: Growing Up in New Zealand. Available from: www.growingup.co.nz
National Emergency Management Agency. Storms and severe weather. Retrieved from https://www.civildefence.govt.nz/cdem-sector/consistent-messages/storms-and-severe-weather
Ministry for the Environment, National Climate Change Risk Assessment for New Zealand: Snapshot. 2020.
Jay, A., et al., Overview, in Impacts, Risks, and Adaptation in the United States: Fourth National Climate Assessment, Volume II, D.R. Reidmiller, et al., Editors. 2018: U.S. Global Change Research Program, Washington, DC, USA. p. 33-71.
NIWA. Auckland suffers wettest month in history. 2023; Available from: https://niwa.co.nz/news/auckland-suffers-wettest-month-in-history.
New Zealand Infrastructure Commission, The 2023 Auckland Anniversary weekend storm: An initial assessment and implications for the infrastructure system 2023.
Newsroom. Auckland’s historic flooding explained in five charts. 2023; Available from: https://www.newsroom.co.nz/sustainable-future/aucklands-historic-flooding-explained-in-five-charts#:~:text=The%20longest%20running%20weather%20record,that%20lasted%20nearly%20four%20decades.
Ministry of Foreign Affairs and Trade, Cyclone Gabrielle’s impact on the New Zealand economy and exports: A market intelligence report. 2023.
Wilson, N., A. Broadbent, and J. Kerr, Cyclone Gabrielle by the numbers – A review at six months. 2023: Public Health Communciation Centre and Department of Public Health, University of Otago, Wellington.
National Emergency Management Agency. Declared States of Emergency. 2023; Available from: https://www.civildefence.govt.nz/resources/previous-emergencies/declared-states-of-emergency.
Hawkes Bay Regional Council. Cyclone Gabrielle impacts. 2023; Available from: https://www.hbrc.govt.nz/our-council/cyclone-gabrielle-response/cyclone-gabrielle-impacts/.
NZTA. Hawke's Bay cyclone recovery. 2023; Available from: https://www.nzta.govt.nz/projects/hawkes-bay-cyclone-recovery/.
Simpson, D.M., I. Weissbecker, and S.E. Sephton, Extreme weather-related events: Implications for mental health and well-being, in Climate change and human well-being: Global challenges and opportunities. 2011, Springer Science + Business Media: New York, NY, US. p. 57-78.
Curtis, S., et al., Impact of extreme weather events and climate change for health and social care systems. Environmental Health, 2017. 16(S1).
Te Uru Kahika, Before the deluge: Building flood resilience in Aotearoa. 2022.
Barkin, J.L., et al., Effects of extreme weather events on child mood and behavior. Developmental Medicine & Child Neurology, 2021. 63(7): p. 785-790.
Beaglehole, B., et al., A systematic review of the psychological impacts of the Canterbury earthquakes on mental health. Australian and New Zealand Journal of Public Health, 2019. 43(3): p. 274-280.
Fergusson, D.M., et al., Impact of a Major Disaster on the Mental Health of a Well-Studied Cohort. JAMA Psychiatry, 2014. 71(9): p. 1025.
Rocque, R.J., et al., Health effects of climate change: an overview of systematic reviews. BMJ Open, 2021. 11(6): p. e046333.
Beaglehole, B., et al., The long-term impacts of the Canterbury earthquakes on the mental health of the Christchurch Health and Development Study cohort. Australian and New Zealand journal of psychiatry, 2023. 57(7): p. 966-974.
Ebi, K.L., et al., Extreme Weather and Climate Change: Population Health and Health System Implications. Annual Review of Public Health, 2021. 42(1): p. 293-315.
Dahl, R.E., et al., Importance of investing in adolescence from a developmental science perspective. Nature, 2018. 554(7693): p. 441-450.
Eiland, L. and R.D. Romeo, Stress and the developing adolescent brain. Neuroscience, 2013. 249: p. 162-171.
Ma, T., J. Moore, and A. Cleary, Climate change impacts on the mental health and wellbeing of young people: A scoping review of risk and protective factors. Soc Sci Med, 2022. 301: p. 114888.
Perry, B., The material wellbeing of New Zealand households: trends and relativities using non-income measures, with international comparisons. 2015: Wellington, New Zealand: Ministry of Social Development.
Perry, B., The material wellbeing of NZ households: Overview and Key Findings from the 2017 Household Incomes Report and the companion report using non-income measures (the 2017 NIMs Report). . 2017: Wellington, New Zealand: Ministry of Social Development. .
Turrell, G., A. Kavanagh, and S.V. Subramanian, Area variation in mortality in Tasmania (Australia): the contributions of socioeconomic disadvantage, social capital and geographic remoteness. Health Place, 2006. 12(3): p. 291-305.
Ministry of Education. Severe weather event education update. 2023; Available from: https://www.education.govt.nz/news/severe-weather-event-education-update/
Ministry of Education. Severe weather event and school closure. 2023; Available from: https://www.education.govt.nz/news/severe-weather-event-information/
Ministry of Education, Schools On-site Attendance 13 February 2023 –17 February 2023. 2023.
Ministry of Education. Severe weather event: Cyclone Gabrielle update. 2023; Available from: https://www.education.govt.nz/news/severe-weather-event-tropical-cyclone-gabrielle-update/.
New Zealand Government, Summary of Initiatives in the North Island Weather Events Response and Recovery Package. 2023.
Tinetti, J. Govt to repair or rebuild all weather-hit schools. 2023; Available from: https://www.beehive.govt.nz/release/govt-repair-or-rebuild-all-weather-hit-schools.
Gheytanchi, A., et al., The dirty dozen: twelve failures of the hurricane katrina response and how psychology can help. Am Psychol, 2007. 62(2): p. 118-30.
IPCC, Managing the Risks of Extreme Events and Disasters to Advance Climate Change Adaptation, in A Special Report of Working Groups I and II of the Intergovernmental Panel on Climate Change, C.B. Field, et al., Editors. 2012: Cambridge University Press, Cambridge, UK, and New York, NY, USA,.
Insurance Council of New Zealand. 2023 Climate Disaster Payouts Top $2 Billion. 2023; Available from: https://www.icnz.org.nz/industry/media-releases/2023-climate-disaster-payouts-top-2-billion/.
Wilson, N., et al., Water infrastructure failures from Cyclone Gabrielle show low resilience to climate change. 2023: Public Health Communciation Centre and Department of Public Health, University of Otago, Wellington.
The Spinoff. Cyclone Gabrielle: The latest official Auckland travel updates from AT and NZTA. 2023; Available from: https://thespinoff.co.nz/society/13-02-2023/cyclone-gabrielle-the-latest-official-auckland-travel-updates-from-at-and-nzta.
Auckland Transport. Updates on Repairs. 2023; Available from: https://at.govt.nz/projects-roadworks/road-works-disruptions/long-term-road-repairs-from-auckland-storms/updates-on-repairs.
Ravens-Sieberer, U., et al., Reliability, construct and criterion validity of the KIDSCREEN-10 score: a short measure for children and adolescents’ well-being and health-related quality of life. Quality of Life Research, 2010. 19(10): p. 1487-1500.
Connor, K.M. and J.R.T. Davidson, Development of a new resilience scale: The Connor-Davidson Resilience Scale (CD-RISC). Depression and Anxiety, 2003. 18(2): p. 76-82.
Radloff, L.S., The CES-D Scale: A Self-Report Depression Scale for Research in the General Population. Applied psychological measurement, 1977. 1(3): p. 385-401.
Irwin, D.E., et al., An item response analysis of the pediatric PROMIS anxiety and depressive symptoms scales. Quality of Life Research, 2010. 19(4): p. 595-607.
Kroenke, K., R.L. Spitzer, and J.B.W. Williams, The PHQ-9. Journal of General Internal Medicine, 2001. 16(9): p. 606-613.
Spitzer, R.L., et al., A Brief Measure for Assessing Generalized Anxiety Disorder. Archives of Internal Medicine, 2006. 166(10): p. 1092.
Ministry of Health, Measuring Health States: The World Health Organization – Long Form (New Zealand Version) Health Survey: Acceptability, reliability, validity and norms for New Zealand. Public Health Intelligence Occasional Bulletin No. 42. 2007: Wellington: Ministry of Health.
Meet our team

Learn more about the people who make Growing Up in New Zealand happen.
Our newsletter

Keep up-to-date with our latest news, events and research.
Current projects

Find out more about the research projects currently underway using Growing Up in New Zealand information.