%201.svg)
Who are the cohort?
Overall, 680 young people and 817 mothers/primary caregivers participated in the Extreme Weather Survey. From these participants, there were 667 family units, meaning that both the young person and mother/primary caregiver took part in the study. In total, 166 (24.4%) young people reported that they were affected by the floods and/or cyclone, 190 (27.9%) reported that they were not affected but they know someone who was affected, and 324 (47.6%) reported they were not affected. Figures 2 - 4 and Table 1 show young people’s ethnic identity, gender identity, area-level deprivation, age and the proportion of young people who were affected by the extreme weather events in each of these groups.
Young person self-reported affected by the extreme weather events.
Figure 2. Shows how affected young people felt by the extreme weather events by young people’s self-reported ethnicity at age 12.
This graph shows young people’s self-reported ethnicity from age 12. Please note that participants who reported more than one ethnic group are counted in each group reported, except for the “Sole European” group which includes those young people who only identified as European.
Overall, 181 (26.6%) identified as Māori, 231 (34.0%) identified as Pacific, 65 (9.6%) identified as Asian, 18 (2.6%) identified as MELAA/Other, and 210 (30.9%) identified as Sole European (missingness: n = 78, 11.5%). Each ethnic group is reported by whether the young person was affected, knew someone else affected, or was not affected by the extreme weather events.
Figure 3. Shows how affected young people felt by the extreme weather events by area-level deprivation quintiles at the 12-year data collection wave.
This graph shows area-level deprivation quintiles when the young people were age 12. Overall, 126 (18.5%) were in quintile 1 (least deprived), 100 (14.7%) in quintile 2, 95 (14.0%) in quintile 3, 105 (15.4%) in quintile 4, 186 (27.4%) in quintile 5 (most deprived) (missingness: n = 68, 10.0%). Each deprivation quintile is reported by whether the young person was affected, knew someone else affected, or was not affected by the extreme weather events.
Figure 4. Shows how affected young people felt by the extreme weather events by self-reported gender identity at age 12.
This graph shows young people’s self-reported gender identity from age 12. Overall, 262 (38.5%) identified as cisgender boy, 222 (32.6%) identified as cisgender girl, and 126 (18.5%) identified as transgender/non-binary/unsure (missingness: n = 70, 10.3%). Each gender identity is reported by whether the young person was affected, knew someone else affected, or was not affected by the extreme weather events.
Table 1: Demographic information for young people who completed the Extreme Weather Survey including ethnicity, gender, area-level deprivation quintiles, region, and age reported by the total sample and by if they were affected by the extreme weather events.
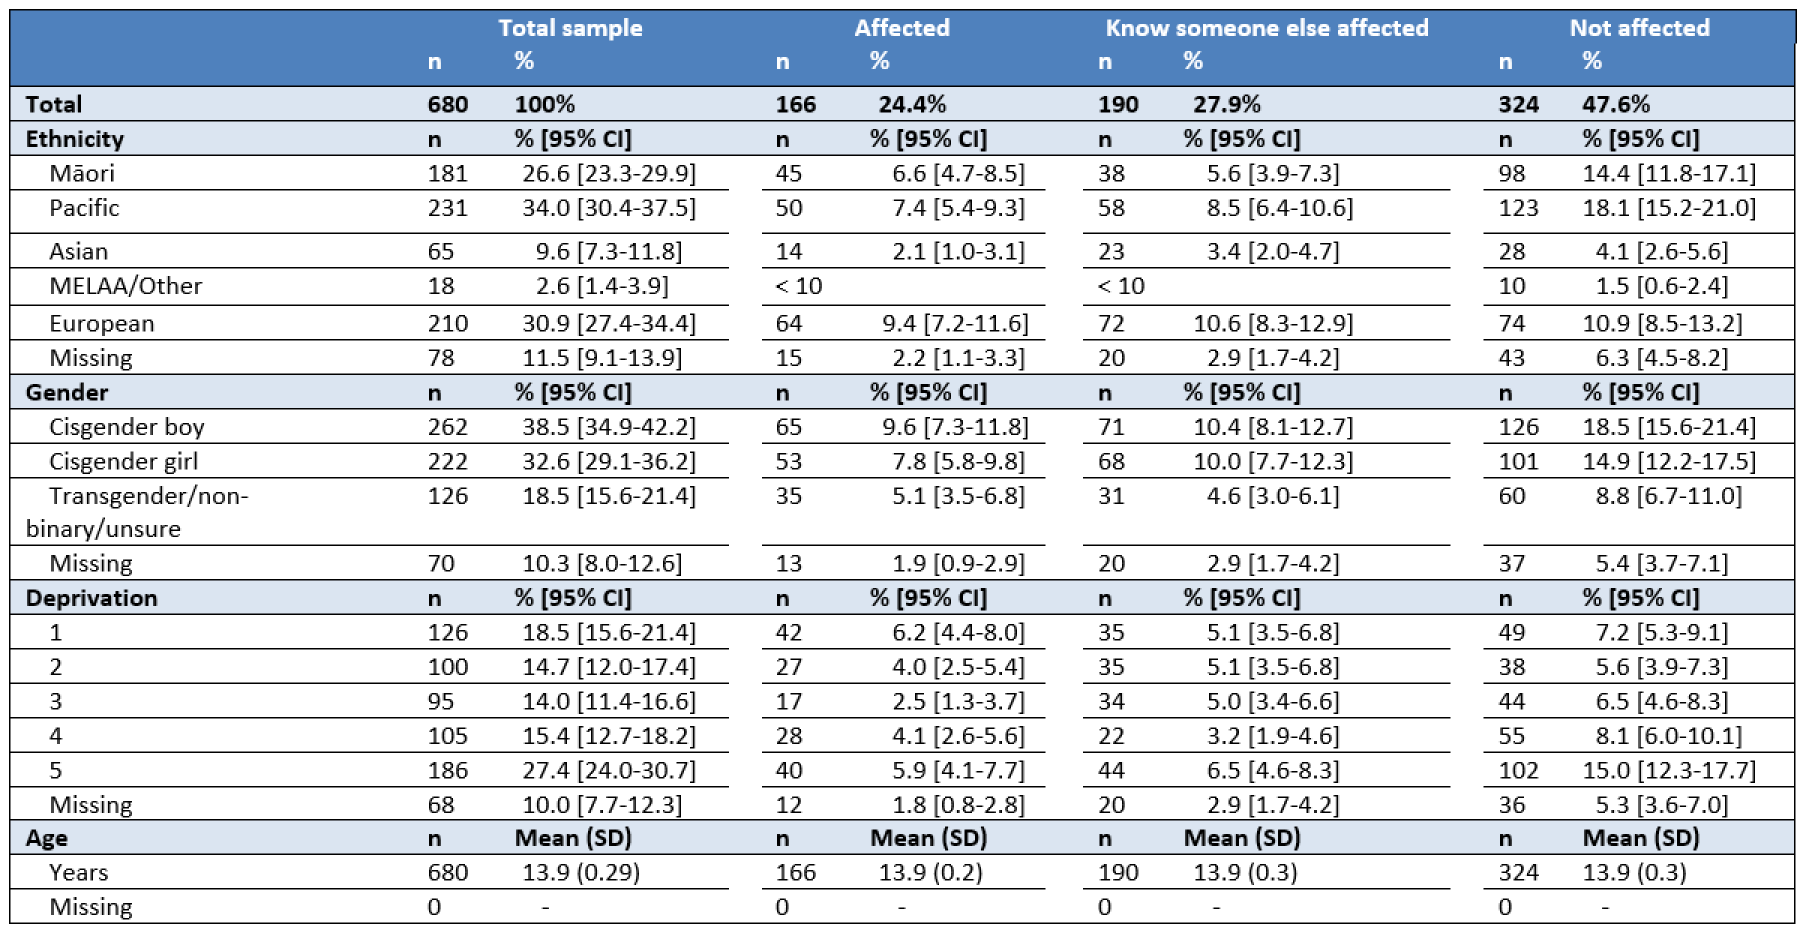
Note. Ethnicity and gender identity were self-reported by the young people at age 12. Area-level deprivation was reported by mother/primary caregiver at the12-year data collection wave.
Mother reported being affected by the extreme weather events.
In total, 217 (26.6%) mothers/primary caregivers reported that they were affected by the floods and/or cyclone, 240 (29.4%) reported they were not affected but live in an area that was affected, and 360 (44.1%) reported they were not affected. Table 2 shows mothers/primary caregivers’ ethnicity, area-level deprivation, age, and the proportion who were affected by the extreme weather events in each of these groups.
Demographic information reported by mother/ primary caregiver who completed the Extreme Weather Survey including ethnicity, area-level deprivation quintiles, region, and age reported by the total sample and by if they were affected by the extreme weather events.

Note. Ethnicity and area-level deprivation were self-reported by mother/primary caregiver at the 12-year data collection wave.
Material Wellbeing
Material wellbeing is a measure of a household’s living standards in terms of having the basics such as adequate food, clothes, accommodation, electricity, heating, and health care [24, 25]. On the other hand, material hardship is going without the necessities [24, 25].
Figure 5. Shows mother-reported material wellbeing (from the 12Y DCW) by how affected they felt by the extreme weather events.
This graph shows the number of households living with no/little material hardship (n = 465, 70.7%), material hardship (n = 75, 11.4%), or severe material hardship (n = 118, 17.9%). Each level of material hardship (bar) is categorised by those who were affected (dark blue; n = 183, 27.8%), live in an area that was affected (light blue; n = 191, 29.0%), or were not affected by the extreme weather events (green; n = 284, 43.2%).
Neighbourhood Engagement
Neighbourhood engagement refers to neighbourhood belonging, safety, and cohesion [26]. Growing Up in New Zealand asked young people 10 questions about their neighbourhood engagement before the floods and/or cyclone. The mean score was calculated across these 10 questions and ranges from 1 to 5, with higher scores indicating greater overall neighbourhood engagement.
Figure 6. Shows young people’s self-reported neighbourhood engagement by how affected they felt by the extreme weather events.
This graph shows the proportion of overall neighbourhood engagement with mean scores ranging from 1 to 5 for three groups of young people: those who were affected (dark blue; n = 166, 24.7%, M = 3.59, 95% CI = 3.48-3.69), knew someone else affected (light blue; n = 184, 27.4%, M = 3.48, 95% CI = 3.39-3.57), or were not affected (green; n = 321, 47.8%, M = 3.40, 95% CI = 3.33-3.47) by the extreme weather events.
Overall, young people who were affected by the extreme weather events reported slightly higher neighbourhood engagement (belonging, safety, and cohesion) than young people who reported they were not affected by the extreme weather events.
School and activities
School activities
The two extreme weather events that occurred in January and February 2023 coincided with the start of the school year for young people in Aotearoa New Zealand. Many of the Growing Up in New Zealand cohort would have been transitioning to Year 9 (first year of secondary school). Following the Auckland Anniversary Weekend flooding, all schools in the Auckland region were closed on Monday 30 and Tuesday 31 January [27, 28]. During Cyclone Gabrielle, over the week of February 13-17, school attendance rates dropped to a low of 52.1% because of school closures [29, 30]. The combination of these two extreme weather events resulted in property and infrastructure damage to over 500 North Island schools [31, 32].
The timing of these extreme weather events may have interfered with young people’s educational experience at the start of 2023. Growing Up in New Zealand asked young people about the impact of the extreme weather events on school and everyday activities.
School
From the young people who participated in the Extreme Weather Survey, more than half (61.8%, n = 420) were starting a new school at the beginning of 2023. Due to the floods and/or cyclone, over two-thirds (67.2%, n = 457) of young people were delayed from starting school. Most young people did not have to change schools or move school buildings (95.9%, n = 652).
The majority of young people (82.4%, n = 560) had time off school because of the extreme weather. Of those 560 young people who had time off school, 4.3% (n = 24) had less than 1 day off, 42.3% (n = 237) had 1-3 days off, 27.3% (n = 153) had 4-5 days off, 19.3% (n = 108) had more than a week off school, and 6.8% (n = 38) said that they didn’t know.
Everyday Life
We asked the young people whether their pet(s) went missing or had to be left behind during the floods and/or cyclone. For the 511 young people who reported having a pet before the extreme weather events, most 96.1% (n = 491) reported that their pet(s) did not go missing, while 3.9% (n = 20) reported that their pet(s) went missing or had to be left behind.
In the days following the floods and cyclone, most young people were able to contact their family (79.9%, n = 543) and friends (80.9%, n = 550), however 20% (n = 136) reported trying to contact family and 19% (n = 129) reported trying to contact friends but not being able to reach them.
Figure 7. Young people’s activities missed due to floods and or cyclone.
Young people were asked how much their everyday activities were interrupted or stopped because of the floods and/or cyclone (not at all, a little, a lot, or not applicable). The everyday activities we asked about were homework, school activities (e.g. arts, music, Kapa Haka), social activities (e.g. sports, going to the mall, marae, church), online games or communication, and seeing friends or family. This graph shows the number of young people who reported that their everyday activities were interrupted or stopped. Each bar represents the activity (school, social, online, friends, family) and shows what percentage of young people answered not at all, a little, a lot, or not applicable.

Young person from Central Auckland

Young person from Te Tai Rāwhiti/Gisborne
Young person from Central Auckland
References
Suggested citation: Gawn, J., Fletcher, B.D., Neumann, D., Pillai, A., Miller, S., Park, A., Napier, C., Paine, S.J. (2024). The impact of extreme weather events on young people and their families: Evidence from Growing Up in New Zealand. Auckland: Growing Up in New Zealand. Available from: www.growingup.co.nz
National Emergency Management Agency. Storms and severe weather. Retrieved from https://www.civildefence.govt.nz/cdem-sector/consistent-messages/storms-and-severe-weather
Ministry for the Environment, National Climate Change Risk Assessment for New Zealand: Snapshot. 2020.
Jay, A., et al., Overview, in Impacts, Risks, and Adaptation in the United States: Fourth National Climate Assessment, Volume II, D.R. Reidmiller, et al., Editors. 2018: U.S. Global Change Research Program, Washington, DC, USA. p. 33-71.
NIWA. Auckland suffers wettest month in history. 2023; Available from: https://niwa.co.nz/news/auckland-suffers-wettest-month-in-history.
New Zealand Infrastructure Commission, The 2023 Auckland Anniversary weekend storm: An initial assessment and implications for the infrastructure system 2023.
Newsroom. Auckland’s historic flooding explained in five charts. 2023; Available from: https://www.newsroom.co.nz/sustainable-future/aucklands-historic-flooding-explained-in-five-charts#:~:text=The%20longest%20running%20weather%20record,that%20lasted%20nearly%20four%20decades.
Ministry of Foreign Affairs and Trade, Cyclone Gabrielle’s impact on the New Zealand economy and exports: A market intelligence report. 2023.
Wilson, N., A. Broadbent, and J. Kerr, Cyclone Gabrielle by the numbers – A review at six months. 2023: Public Health Communciation Centre and Department of Public Health, University of Otago, Wellington.
National Emergency Management Agency. Declared States of Emergency. 2023; Available from: https://www.civildefence.govt.nz/resources/previous-emergencies/declared-states-of-emergency.
Hawkes Bay Regional Council. Cyclone Gabrielle impacts. 2023; Available from: https://www.hbrc.govt.nz/our-council/cyclone-gabrielle-response/cyclone-gabrielle-impacts/.
NZTA. Hawke's Bay cyclone recovery. 2023; Available from: https://www.nzta.govt.nz/projects/hawkes-bay-cyclone-recovery/.
Simpson, D.M., I. Weissbecker, and S.E. Sephton, Extreme weather-related events: Implications for mental health and well-being, in Climate change and human well-being: Global challenges and opportunities. 2011, Springer Science + Business Media: New York, NY, US. p. 57-78.
Curtis, S., et al., Impact of extreme weather events and climate change for health and social care systems. Environmental Health, 2017. 16(S1).
Te Uru Kahika, Before the deluge: Building flood resilience in Aotearoa. 2022.
Barkin, J.L., et al., Effects of extreme weather events on child mood and behavior. Developmental Medicine & Child Neurology, 2021. 63(7): p. 785-790.
Beaglehole, B., et al., A systematic review of the psychological impacts of the Canterbury earthquakes on mental health. Australian and New Zealand Journal of Public Health, 2019. 43(3): p. 274-280.
Fergusson, D.M., et al., Impact of a Major Disaster on the Mental Health of a Well-Studied Cohort. JAMA Psychiatry, 2014. 71(9): p. 1025.
Rocque, R.J., et al., Health effects of climate change: an overview of systematic reviews. BMJ Open, 2021. 11(6): p. e046333.
Beaglehole, B., et al., The long-term impacts of the Canterbury earthquakes on the mental health of the Christchurch Health and Development Study cohort. Australian and New Zealand journal of psychiatry, 2023. 57(7): p. 966-974.
Ebi, K.L., et al., Extreme Weather and Climate Change: Population Health and Health System Implications. Annual Review of Public Health, 2021. 42(1): p. 293-315.
Dahl, R.E., et al., Importance of investing in adolescence from a developmental science perspective. Nature, 2018. 554(7693): p. 441-450.
Eiland, L. and R.D. Romeo, Stress and the developing adolescent brain. Neuroscience, 2013. 249: p. 162-171.
Ma, T., J. Moore, and A. Cleary, Climate change impacts on the mental health and wellbeing of young people: A scoping review of risk and protective factors. Soc Sci Med, 2022. 301: p. 114888.
Perry, B., The material wellbeing of New Zealand households: trends and relativities using non-income measures, with international comparisons. 2015: Wellington, New Zealand: Ministry of Social Development.
Perry, B., The material wellbeing of NZ households: Overview and Key Findings from the 2017 Household Incomes Report and the companion report using non-income measures (the 2017 NIMs Report). . 2017: Wellington, New Zealand: Ministry of Social Development. .
Turrell, G., A. Kavanagh, and S.V. Subramanian, Area variation in mortality in Tasmania (Australia): the contributions of socioeconomic disadvantage, social capital and geographic remoteness. Health Place, 2006. 12(3): p. 291-305.
Ministry of Education. Severe weather event education update. 2023; Available from: https://www.education.govt.nz/news/severe-weather-event-education-update/
Ministry of Education. Severe weather event and school closure. 2023; Available from: https://www.education.govt.nz/news/severe-weather-event-information/
Ministry of Education, Schools On-site Attendance 13 February 2023 –17 February 2023. 2023.
Ministry of Education. Severe weather event: Cyclone Gabrielle update. 2023; Available from: https://www.education.govt.nz/news/severe-weather-event-tropical-cyclone-gabrielle-update/.
New Zealand Government, Summary of Initiatives in the North Island Weather Events Response and Recovery Package. 2023.
Tinetti, J. Govt to repair or rebuild all weather-hit schools. 2023; Available from: https://www.beehive.govt.nz/release/govt-repair-or-rebuild-all-weather-hit-schools.
Gheytanchi, A., et al., The dirty dozen: twelve failures of the hurricane katrina response and how psychology can help. Am Psychol, 2007. 62(2): p. 118-30.
IPCC, Managing the Risks of Extreme Events and Disasters to Advance Climate Change Adaptation, in A Special Report of Working Groups I and II of the Intergovernmental Panel on Climate Change, C.B. Field, et al., Editors. 2012: Cambridge University Press, Cambridge, UK, and New York, NY, USA,.
Insurance Council of New Zealand. 2023 Climate Disaster Payouts Top $2 Billion. 2023; Available from: https://www.icnz.org.nz/industry/media-releases/2023-climate-disaster-payouts-top-2-billion/.
Wilson, N., et al., Water infrastructure failures from Cyclone Gabrielle show low resilience to climate change. 2023: Public Health Communciation Centre and Department of Public Health, University of Otago, Wellington.
The Spinoff. Cyclone Gabrielle: The latest official Auckland travel updates from AT and NZTA. 2023; Available from: https://thespinoff.co.nz/society/13-02-2023/cyclone-gabrielle-the-latest-official-auckland-travel-updates-from-at-and-nzta.
Auckland Transport. Updates on Repairs. 2023; Available from: https://at.govt.nz/projects-roadworks/road-works-disruptions/long-term-road-repairs-from-auckland-storms/updates-on-repairs.
Ravens-Sieberer, U., et al., Reliability, construct and criterion validity of the KIDSCREEN-10 score: a short measure for children and adolescents’ well-being and health-related quality of life. Quality of Life Research, 2010. 19(10): p. 1487-1500.
Connor, K.M. and J.R.T. Davidson, Development of a new resilience scale: The Connor-Davidson Resilience Scale (CD-RISC). Depression and Anxiety, 2003. 18(2): p. 76-82.
Radloff, L.S., The CES-D Scale: A Self-Report Depression Scale for Research in the General Population. Applied psychological measurement, 1977. 1(3): p. 385-401.
Irwin, D.E., et al., An item response analysis of the pediatric PROMIS anxiety and depressive symptoms scales. Quality of Life Research, 2010. 19(4): p. 595-607.
Kroenke, K., R.L. Spitzer, and J.B.W. Williams, The PHQ-9. Journal of General Internal Medicine, 2001. 16(9): p. 606-613.
Spitzer, R.L., et al., A Brief Measure for Assessing Generalized Anxiety Disorder. Archives of Internal Medicine, 2006. 166(10): p. 1092.
Ministry of Health, Measuring Health States: The World Health Organization – Long Form (New Zealand Version) Health Survey: Acceptability, reliability, validity and norms for New Zealand. Public Health Intelligence Occasional Bulletin No. 42. 2007: Wellington: Ministry of Health.
Meet our team

Learn more about the people who make Growing Up in New Zealand happen.
Our newsletter

Keep up-to-date with our latest news, events and research.
Current projects

Find out more about the research projects currently underway using Growing Up in New Zealand information.